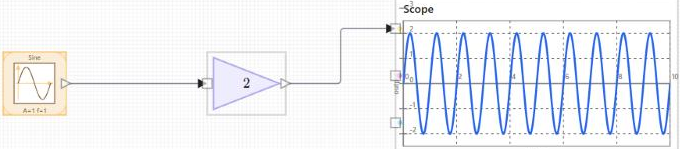
This is the first of three short tutorials. You build a model with three blocks, a Sine source, a Gain, and a Scope, then run it and read the result. The model has no feedback and no dynamics, so it is a good way to learn the editor itself: placing blocks, drawing wires, editing parameters, and running a simulation.
Open the editor
Call nflow() from the Nelson command line to open an empty model. The block library is on the left, the diagram canvas is in the center, and the inspector is on the right. Select a block to see its parameters in the inspector, or select nothing to see the Model tab with the simulation settings.
Place the blocks
Leave room between the blocks so the wires have space to route.
Connect the blocks
When autoRoute is on, the editor keeps the wires orthogonal and clear as you move blocks. See nflow_wire_editing for manual routing, corners, and junctions.
Set the block parameters
Select the Gain block and set Gain to 2 in the inspector. Select the Sine block to set its amplitude and frequency, or keep the defaults. Each change is applied to the block as you type.
Set the run duration
Select nothing to show the Model tab, then open Simulation. Set Runtime (s) to the length of the run, for example 10. Leave Sample Time (s) at its default for this model.
Run the model
Press Run in the toolbar above the diagram, or use the Simulation menu. The Scope fills while the model runs. Stop ends the run and keeps the results already computed. Reset returns time to zero and clears the displayed results.
Read the scope
The Scope shows the amplified sine wave. Select the Scope and use the inspector to set the time and value ranges (t min, t max, y min, y max), to show tick labels, and to set the trace color and axis labels. Leave a range field empty to let the Scope fit the data.
What to try next
Replace the Sine with a Step or a Pulse from the Source group to see how the output follows a different input. Then continue with nflow_tutorial_continuous to add an integrator and choose a solver.