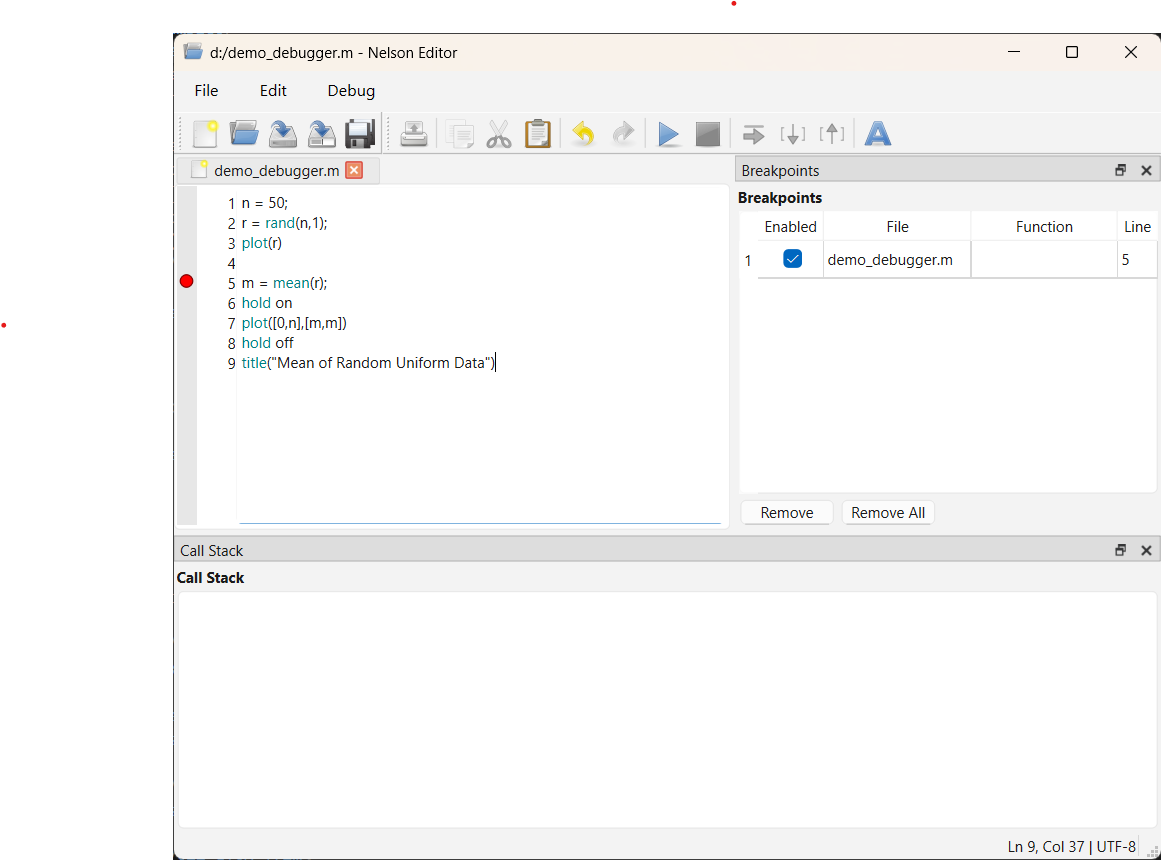
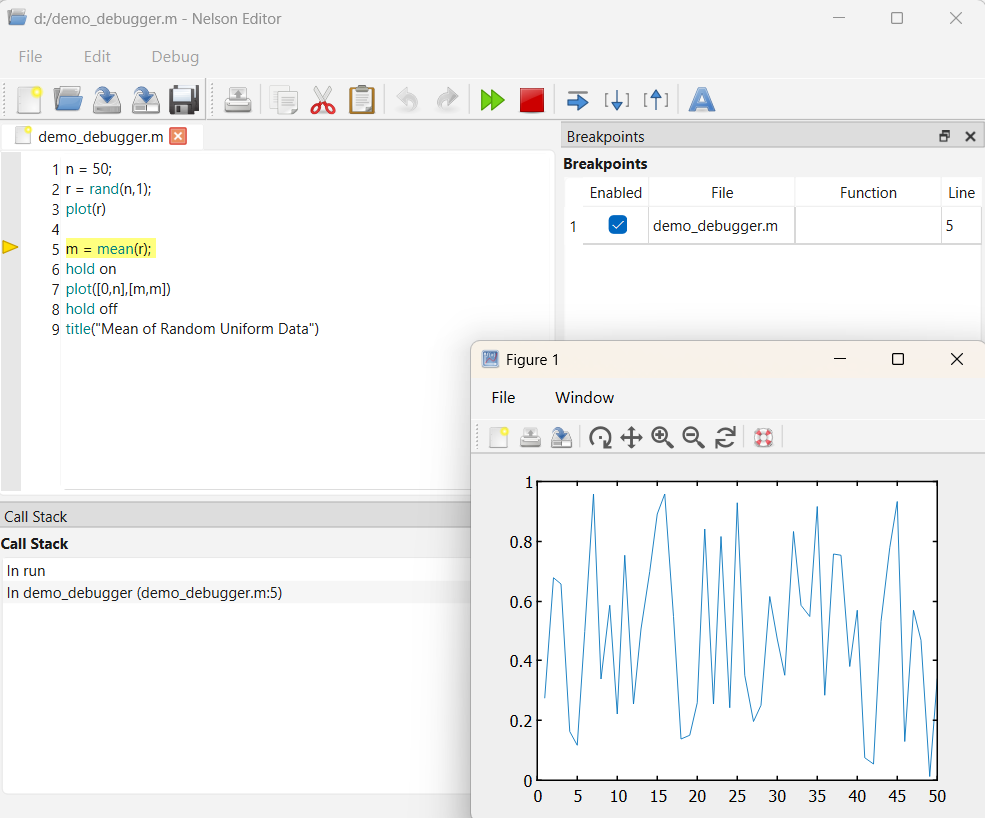
The Nelson debugger provides interactive tools to diagnose and fix
problems in scripts and functions by controlling execution and
inspecting program state.
A typical debugging workflow consists of preparing the code,
pausing execution at specific locations, examining variable values,
stepping through instructions, and resuming or stopping execution.
Before starting a debugging session, ensure that all code files
are saved and accessible from the current folder or search path.
Unsaved changes may not be taken into account when running code
from the command line.
Execution can be paused by setting breakpoints or interrupting
a running program. When execution is paused, Nelson enters debug
mode and the command prompt changes to indicate that the debugger
has control.
While execution is paused, the current line has not yet been
executed. You can inspect variables in the current workspace,
execute code line by line, step into or out of functions, or
continue execution until the next breakpoint.
Each function has its own workspace. When stepping into a function,
the active workspace changes to reflect the function context.
After identifying the problem, end the debugging session to return
to normal execution mode. Ending the session restores the standard
command prompt and clears the debugger context.