J = imadjust(I)
J = imadjust(I, in)
J = imadjust(I, in, out)
J = imadjust(I, in, out, gamma)
| Parameter | Description |
|---|---|
| I | Input grayscale image, RGB image, or double colormap. |
| in | Input intensity limits, as a 2-by-1 vector or 2-by-N per-channel matrix. |
| out | Output intensity limits, as a 2-by-1 vector or 2-by-N per-channel matrix. |
| gamma | Gamma correction scalar or per-channel vector. |
| Parameter | Description |
|---|---|
| J | Adjusted image or colormap. |
Adjust image intensity values. Grayscale images use 2-by-1 limits; RGB images can use 2-by-3 limits and per-channel gamma values.
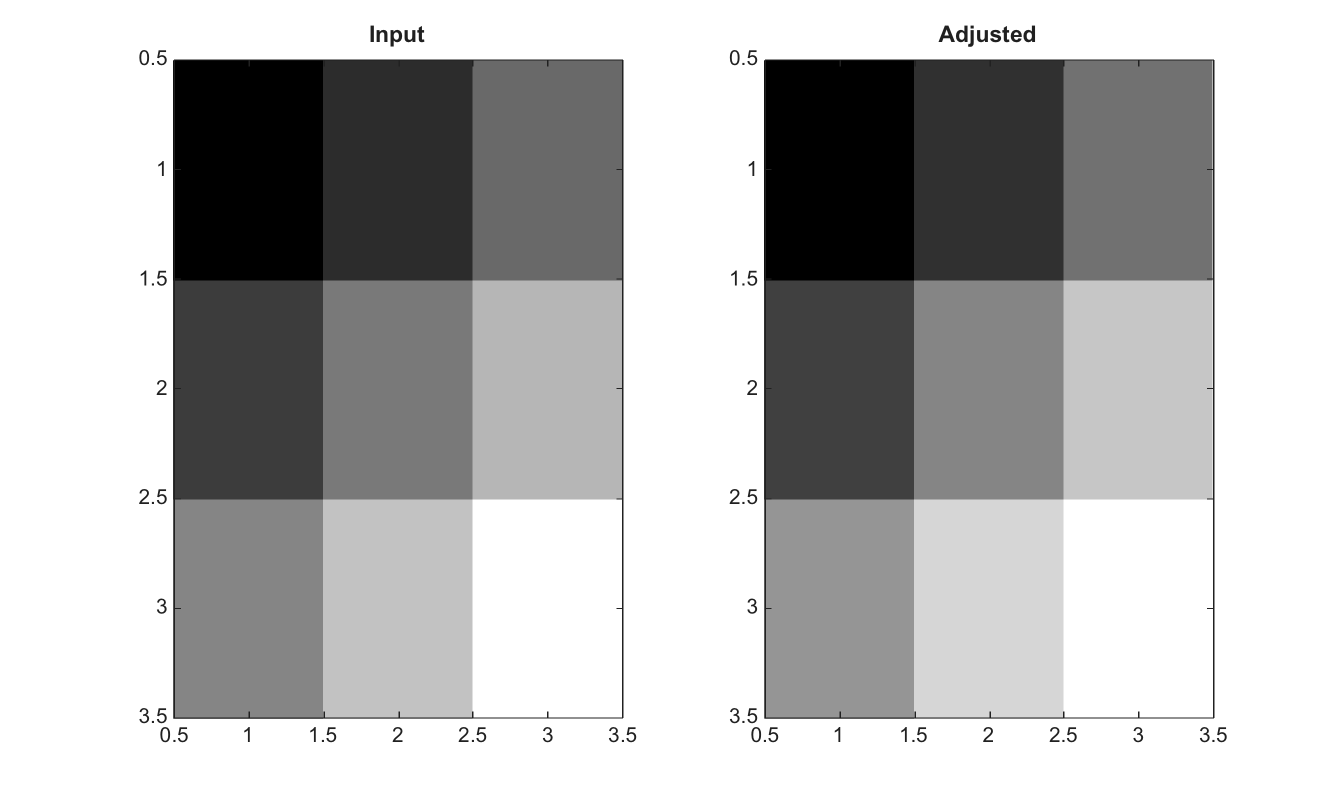
I=uint8([50 80 120; 90 130 170; 140 180 220]);
J=imadjust(I,[0.2;0.8],[]);
figure; subplot(1,2,1); imagesc(I); g=linspace(0,1,64)'; colormap([g g g]); title('Input');
subplot(1,2,2); imagesc(J); g=linspace(0,1,64)'; colormap([g g g]); title('Adjusted');
| Version | Description |
|---|---|
| 2.0.0 | initial version |