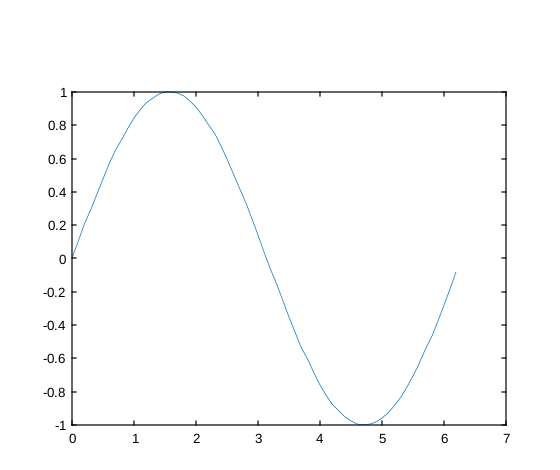
A human-readable reference and definitive example set describing the XML help file format defined bynelson_help.xsd, and hownelson_html.xslttransforms its elements into HTML.
Use`<description>`to provide the main documentation body. It accepts paragraphs (`<p>`), lists (`<ul>`,`<ol>`), tables (`<table>`), inline markup (`<b>`,`<i>`,`<code>`), images (`<img src="..."/>`) and LaTeX (`<latex>`).
Inline elements and their XSLT rendering:
-
`<b>` - bold text.
-
`<i>` - italic text.
-
`<code>` - inline code rendering.
-
`<a href="..."
>` - external links (rendered as HTML anchors).
-
`<link linkend="..."
>` - internal cross reference. If linkend contains a module in braces
{module}nameit becomes../module/name.html, otherwisename.html.
-
`<latex>` - math expressions; rendered as MathJax display math by the XSLT template (wrapped with
`$$...$$`).
-
`<img src="..."/>` - images. XSLT calls
ext:copy_img(@src); SVGs are rendered with a large fixed frame and other formats are responsive.
Block elements:
-
`<ul>`and`<ol>`- lists. Use`<li>`with nested inline/block markup as needed.
-
`<table>`- use`<thead>`,`<tbody>`,`<tr>`,`<th>`and`<td>`. The XSD allows common attributesborder,cellpaddingandcellspacing.
Authoring tips:
Prefer short summary lines for`<short_description>`.
Place runnable examples inside`<examples>`using`<example_item_data>`and set`runnable="cli"`if applicable or`runnable="false"`(default).
Wrap example source in CDATA to avoid escaping (see examples below).
Use`<link linkend="{module}name"
>`for module-qualified references; otherwise use plain names.
Subchapter support - Nelson's help system supports nested subchapters. To add one:
Create a subdirectory under your module help XML folder (for example plots).
In that directory add a `chapter.xml` file containing at least `<language>` and `<chapter>`, and an optional `<chapter_description>`.
Place topic XML files (for example mesh.xml) inside the subdirectory; topic files use the usual elements such as `<keyword>` and `<short_description>`.
Link to nested pages using slash-separated paths: same-module links use `<link linkend="plots/mesh"
>mesh</link>`, cross-module links use `<link linkend="{module}plots/mesh"
>mesh</link>`.
The buildhelp tool and XSLT resolve these paths and will generate nested HTML pages (for example plots/mesh.html).