legend
Add a legend to axes.
📝Syntax
legend()
legend(label1, ..., labelN)
legend(labels)
legend(plotHandles, labels)
legend('off')
legend('hide')
legend('show')
legend('toggle')
legend('boxon')
legend('boxoff')
legend(ax, ...)
legend(ax, plotHandles, labels)
legend(..., 'Location', lcn)
legend(..., propertyName, propertyValue)
L = legend(...)
[L, icons, plots, text] = legend(...)
📥Input Arguments
Parameter Description
label1, ..., labelN sets the legend labels: character vectors or string scalars.
labels cell array of character vectors or string array.
plotHandles graphics objects to include in the legend.
'off' delete the legend.
'toggle' toggle legend visibility.
'hide' hide the legend.
'show' show the legend.
'boxon' display the box around the legend.
'boxoff' hide the box around the legend.
ax target axes or polar axes.
lcn legend location string. The default is 'northeast'.
propertyName a scalar string or character vector.
propertyValue a value.
📤Output Arguments
Parameter Description
L a legend graphics object.
icons graphics object vector reserved for legend icon objects.
plots graphics objects represented by the legend.
text graphics object vector reserved for legend text objects.
📄Description

legend creates or updates a legend attached to the target axes.

When labels are omitted, labels are taken from the DisplayName property of the plotted objects. If AutoUpdate is on, newly added plotted objects are included automatically.

Location for legend on the plot:

'northeast' or 'NE': top right (default).

'north' or 'N': top center.

'south' or 'S': bottom center.

'east' or 'E': middle right.

'west' or 'W': middle left.

'northwest' or 'NW': top left.

'southeast' or 'SE': bottom right.

'southwest' or 'SW': bottom left.

Outside locations are also supported: 'northoutside', 'southoutside', 'eastoutside', and 'westoutside'.

See legend properties for the complete property list.

💡Examples
f = figure();
x = linspace(0, 10);
y1 = sin(x);
y2 = cos(x);
ax = gca();
plot(ax, x, y1, 'DisplayName', 'sin(x)');
hold(ax, 'on');
plot(ax, x, y2, 'DisplayName', 'cos(x)');
legend(ax, 'Location', 'N')
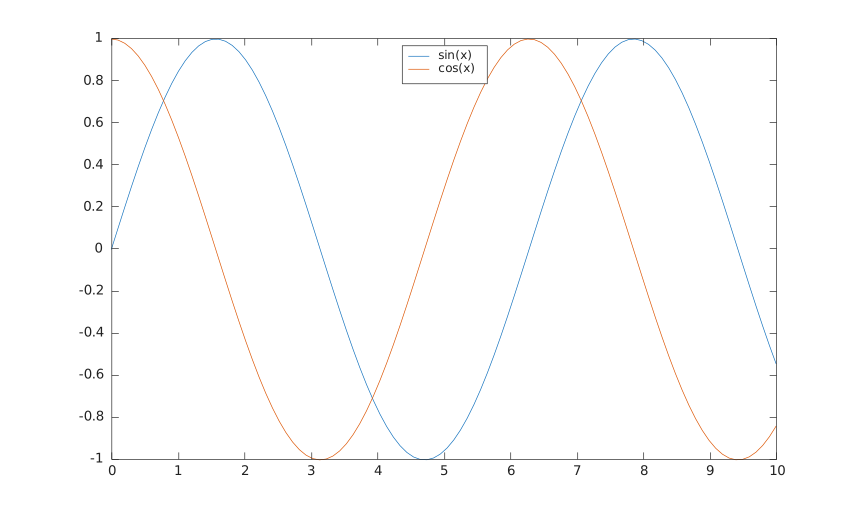
Example illustration
f = figure();
x = 1:5;
plot(x, x);
hold on
plot(x, x .^ 2);
lgd = legend({'linear'; 'quadratic'}, 'NumColumns', 2);
title(lgd, 'Curves')
🔗See Also
legend propertiestitletextplot
🕔Version History
Version Description
1.0.0 initial version
Edit this page on GitHub