Examples
f = figure();
x = linspace(0, 10);
yyaxis left
plot(x, sin(x))
ylabel('left side')
yyaxis right
plot(x, 100 * cos(x))
ylabel('right side')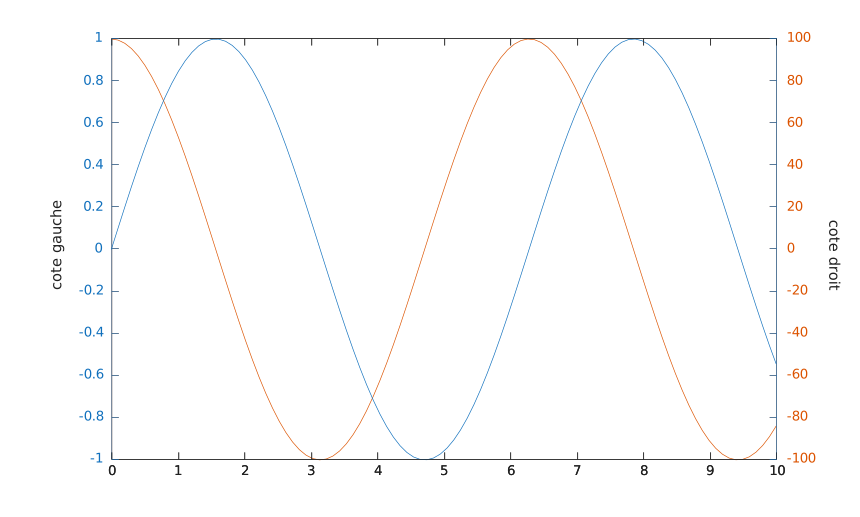
yyaxis left
yyaxis right
yyaxis(ax, 'left')
yyaxis(ax, 'right')
| Parameter | Description |
|---|---|
| 'left' | Activate the left side. New plots are added to the left y-axis. |
| 'right' | Activate the right side. New plots are added to the right y-axis. |
| ax | Target axes: axes. |
yyaxis creates a chart with two y-axes and selects the active side. If the current axes does not already have two y-axes, one is added; if there is no current axes, one is created.
The two sides share the same x-axis but each has its own limits, colour, scale, direction, ticks, label and children. Properties whose name starts with Y (such as YLim, YColor or YLabel) apply to the active side only. Query YAxisLocation to know which side is active.
By default the left ruler uses the first colour of the axes ColorOrder and the right ruler the second colour.
The two rulers are also available as objects through the axes YAxis property: YAxis(1) is the left ruler and YAxis(2) the right ruler, whatever the active side.
cla reset removes the second y-axis and returns to a single y-axis.
f = figure();
x = linspace(0, 10);
yyaxis left
plot(x, sin(x))
ylabel('left side')
yyaxis right
plot(x, 100 * cos(x))
ylabel('right side')| Version | Description |
|---|---|
| 2.0.0 | initial version |