Examples
Display a 3-D stem plot from a matrix.
Z = peaks(8);
stem3(Z);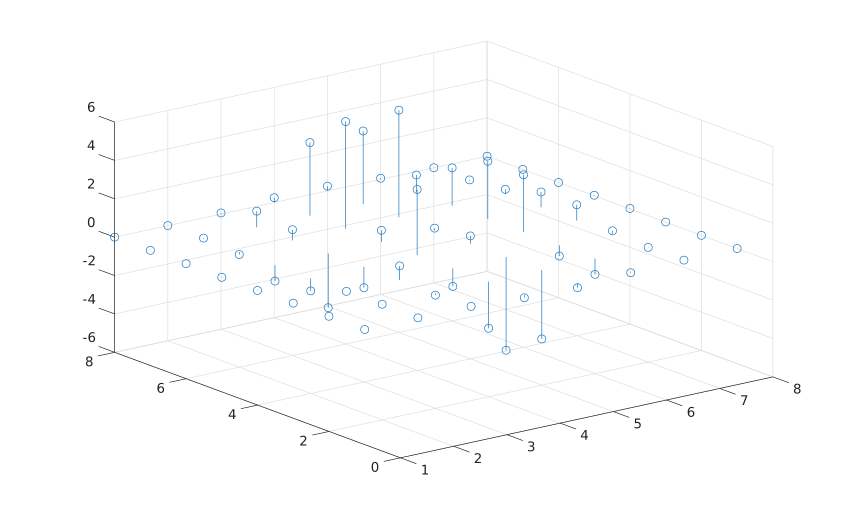
Specify coordinates and fill markers.
t = 0:0.2:2*pi;
stem3(cos(t), sin(t), t, 'r--', 'filled');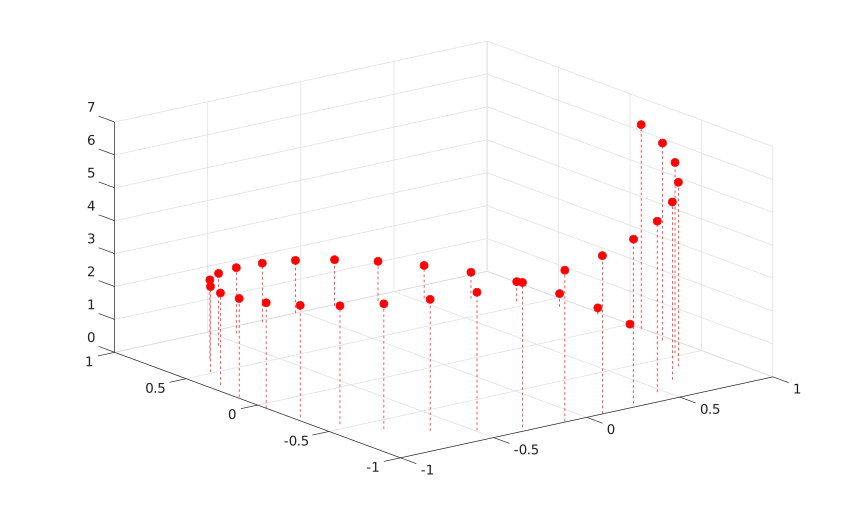
stem3(Z)
stem3(X, Y, Z)
stem3(..., LineSpec)
stem3(..., 'filled')
stem3(parent, ...)
h = stem3(...)
| Parameter | Description |
|---|---|
| Z | Stem heights: numeric vector or matrix. |
| X | X coordinates: numeric vector or matrix. |
| Y | Y coordinates: numeric vector or matrix. |
| LineSpec | Line style, marker, and color specification. |
| parent | Axes or hggroup parent. |
| Parameter | Description |
|---|---|
| h | Stem graphics object. |
stem3 displays vertical stems from z = 0 to the values in Z, with markers at the stem tips.
The returned object is a stem graphics object. See nelson.graphics.stem.properties for supported properties.
Z = peaks(8);
stem3(Z);t = 0:0.2:2*pi;
stem3(cos(t), sin(t), t, 'r--', 'filled');