Examples
Create a Pareto chart.
pareto([5 20 10], {'A', 'B', 'C'});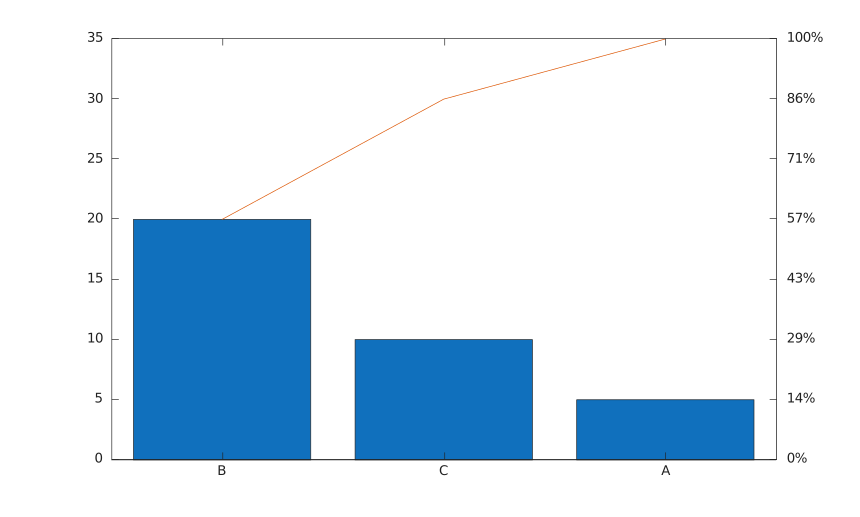
pareto(y)
pareto(y, threshold)
pareto(y, labels)
pareto(y, labels, threshold)
pareto(parent, ...)
h = pareto(...)
pareto sorts nonnegative values in descending order, displays bars, and overlays a cumulative line. threshold is a scalar between 0 and 1 that controls how many sorted labels are displayed.
pareto([5 20 10], {'A', 'B', 'C'});