Examples
Trace a rising spiral through a rotating field.
[x, y, z] = meshgrid(-2:0.5:2, -2:0.5:2, -2:0.5:2);
vertices = stream3(x, y, z, -y, x, 0.2 * ones(size(x)), 1, 0, -2);
streamline(vertices);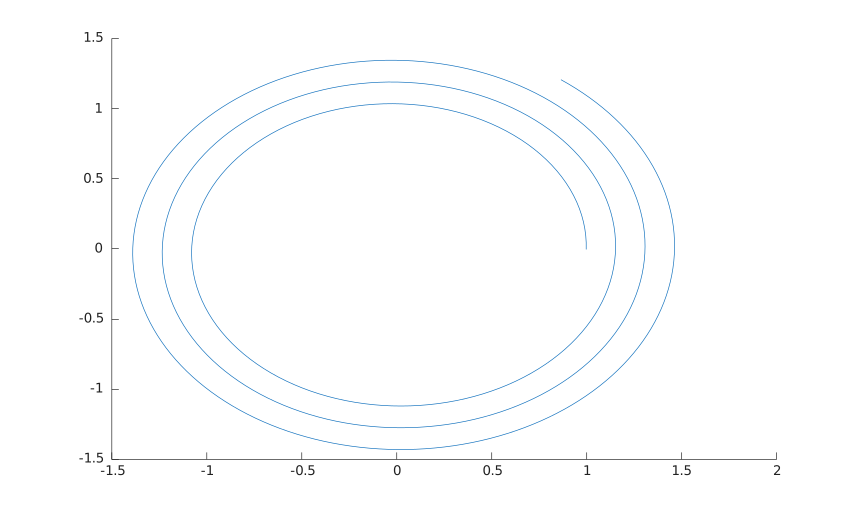
vertices = stream3(U, V, W, startx, starty, startz)
vertices = stream3(X, Y, Z, U, V, W, startx, starty, startz)
vertices = stream3(..., options)
stream3 follows a 3-D vector field from each start point and returns the vertices it passed through. Nothing is drawn: hand the result to streamline to see it.
The result is a cell array with one entry per start point, each an N-by-3 array of [x, y, z] coordinates whose first row is the start point itself. A start point outside the field gives an empty entry; a start point the field does not move keeps its single vertex.
Without X, Y and Z the field is indexed from 1.
The optional options input is [stepsize] or [stepsize, maxvert]. stepsize is counted in grid cells and defaults to 0.1. maxvert is the largest number of vertices to produce, the start point counted in, and defaults to 500.
[x, y, z] = meshgrid(-2:0.5:2, -2:0.5:2, -2:0.5:2);
vertices = stream3(x, y, z, -y, x, 0.2 * ones(size(x)), 1, 0, -2);
streamline(vertices);