heatmap
Create a heatmap chart from a numeric matrix or table.
📝Syntax
heatmap(C)
heatmap(xvalues, yvalues, C)
heatmap(tbl, xvar, yvar)
heatmap(tbl, xvar, yvar, 'ColorVariable', cvar)
heatmap(parent, ...)
heatmap(..., propertyName, propertyValue)
h = heatmap(...)
📥Input Arguments
Parameter Description
C Numeric matrix used as color data.
xvalues Labels for matrix columns: cell string, string, character, or numeric vector.
yvalues Labels for matrix rows: cell string, string, character, or numeric vector.
tbl Source table used to calculate heatmap values.
xvar Table variable used for x categories.
yvar Table variable used for y categories.
cvar Numeric table variable averaged for each x/y category pair.
parent Axes or hggroup parent.
propertyName Supported property name.
propertyValue Property value.
📤Output Arguments
Parameter Description
h Heatmap chart object containing the heatmap image, grid, labels, and colorbar state.
📄Description

heatmap displays a numeric matrix as a scaled color image with row and column labels. For table input, categories are sorted and the color data is aggregated by category pair.

With heatmap(tbl, xvar, yvar), color data contains counts and ColorMethod is count. With ColorVariable, color data contains means and ColorMethod is mean.

This implementation returns a heatmap chart object. The chart UserData contains the fields ChartType, Image, Grid, CellLabels, Colorbar, XData, YData, ColorData, SourceTable, XVariable, YVariable, ColorVariable, ColorMethod, and Options.

Supported name/value properties are Title, XLabel, YLabel, SourceTable, XVariable, YVariable, ColorVariable, ColorMethod, XData, YData, XDisplayLabels, YDisplayLabels, ColorLimits, Colormap, ColorbarVisible, GridVisible, CellLabelFormat, CellLabelColor, MissingDataLabel, FontColor, FontSize, and Visible.

💡Examples
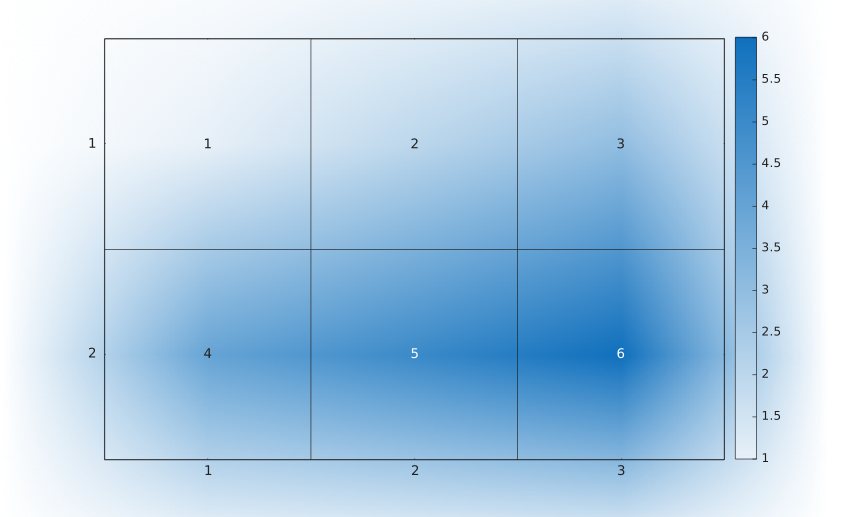
Display a numeric heatmap.
C = [1 2 3; 4 5 6];
heatmap(C);
Example illustration
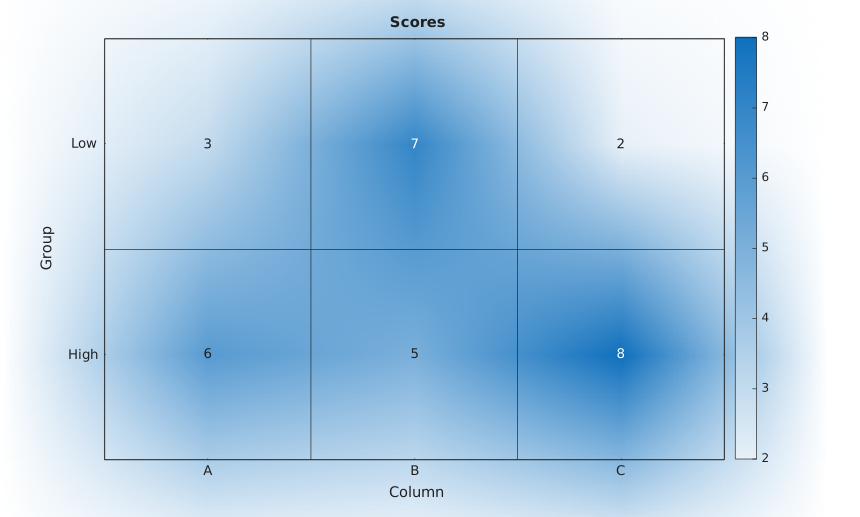
Use row and column labels.
C = [3 7 2; 6 5 8];
heatmap({'A', 'B', 'C'}, {'Low', 'High'}, C, ...
  'Title', 'Scores', 'XLabel', 'Column', 'YLabel', 'Group');
Example illustration
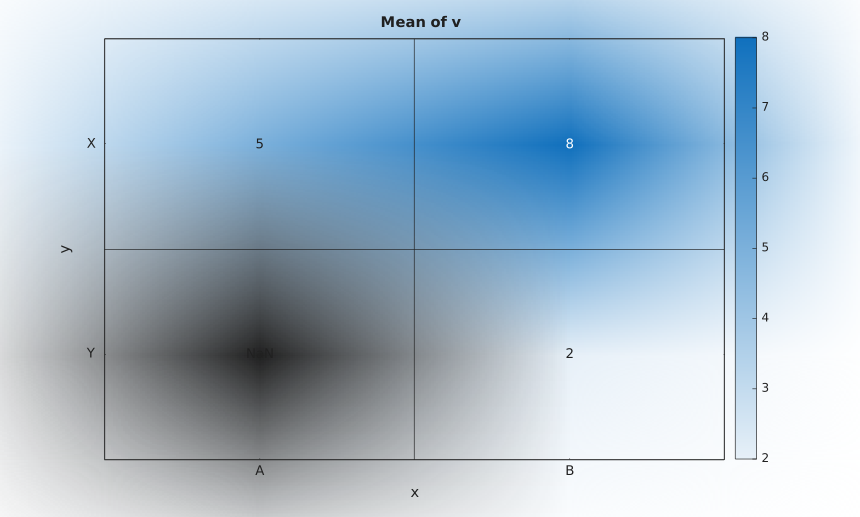
Create a heatmap from table categories.
T = table({'B'; 'A'; 'B'}, {'Y'; 'X'; 'X'}, [2; 5; 8], ...
  'VariableNames', {'x', 'y', 'v'});
heatmap(T, 'x', 'y', 'ColorVariable', 'v');
Example illustration
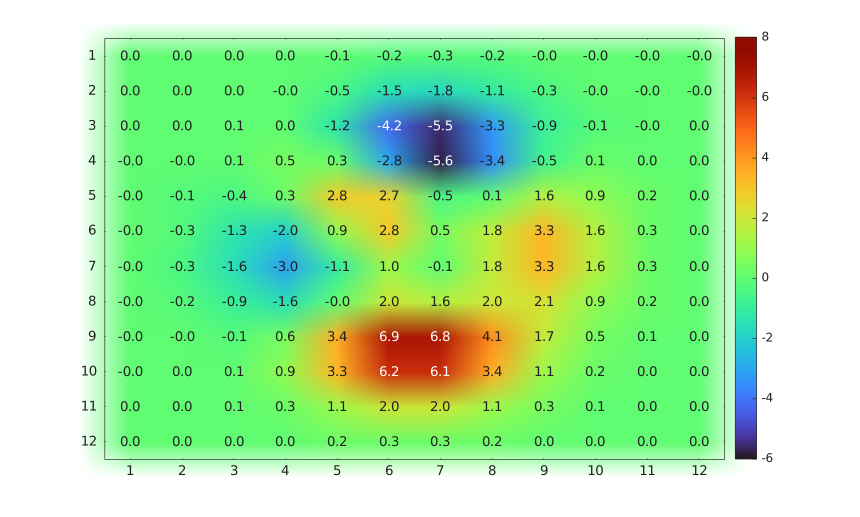
Customize colors and labels.
C = peaks(12);
heatmap(C, 'ColorLimits', [-6 8], 'Colormap', turbo(64), ...
  'CellLabelFormat', '%0.1f', 'GridVisible', 'off');
Example illustration
🔗See Also
imagesccolorbarcolormap
Edit this page on GitHub