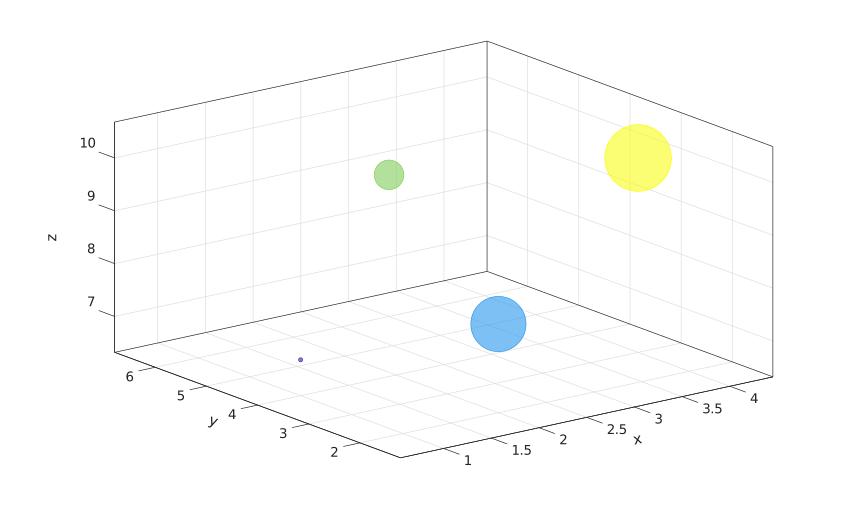
bubblechart3(x, y, z, sz)
bubblechart3(x, y, z, sz, c)
bubblechart3(tbl, xvar, yvar, zvar, szvar)
bubblechart3(tbl, xvar, yvar, zvar, szvar, cvar)
bubblechart3(parent, ...)
bubblechart3(..., propertyName, propertyValue)
h = bubblechart3(...)
bubblechart3 displays a 3-D scatter plot whose marker sizes are controlled by sz.
c specifies bubble colors. It can be a color name, short color name, RGB triplet, color vector, or RGB matrix.
Table input selects data from variables in tbl. Each variable selector can be a variable name, string, index, logical selector, or a cell/string vector of names. Multiple selected variables create multiple bubblechart objects.
The returned handle is a bubblechart object with XData, YData, ZData, and SizeData.
See bubblechart properties for the complete property list.
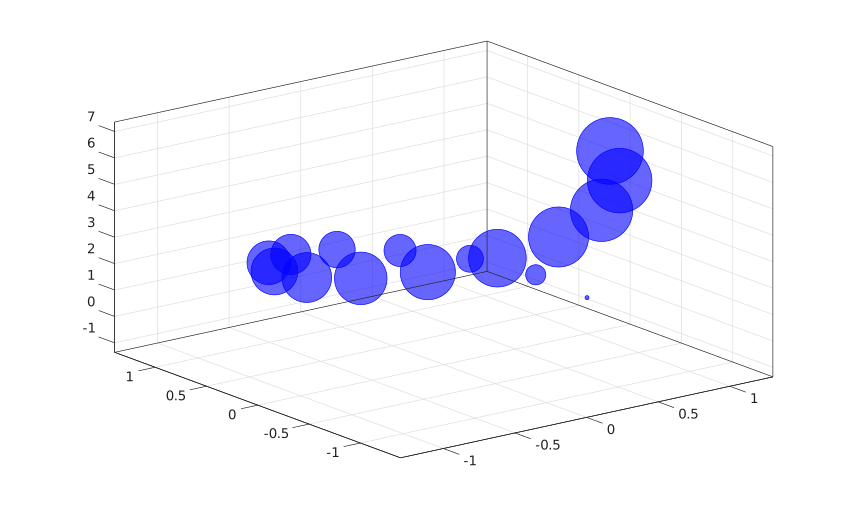
t = 0:0.4:2*pi;
bubblechart3(cos(t), sin(t), t, 30 + 20 * t, 'b');
t = table((1:4)', [4; 2; 6; 3], [7; 8; 9; 10], [20; 60; 30; 80], [1; 2; 3; 4], ...
'VariableNames', {'x', 'y', 'z', 's', 'c'});
h = bubblechart3(t, 'x', 'y', 'z', 's', 'c');