Examples
G = tf([3], [1 1/2 4]);
opt = bodeoptions();
opt.PhaseUnits = 'rad';
opt.Grid = 'on';
f = figure();
bodeplot(G, opt, '--');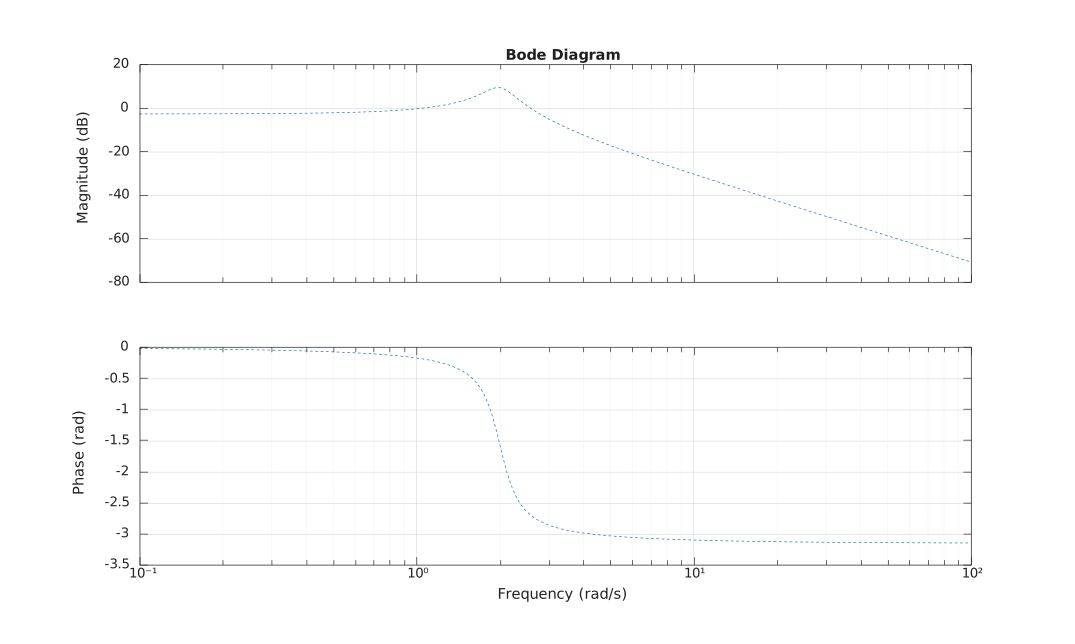
bodeplot(sys)
bodeplot(sys, opt)
bodeplot(sys, lineSpec)
bodeplot(sys, opt, lineSpec)
bodeplot(sys, w, ...)
[magnitude, phase, w] = bodeplot(...)
| Parameter | Description |
|---|---|
| sys | a SISO LTI model. |
| opt | an options structure returned by bodeoptions. |
| lineSpec | Line style, marker, and color. |
| w | a cell {wmin, wmax} or a frequency vector. |
| Parameter | Description |
|---|---|
| magnitude | Magnitude: size 1 x 1 x k (SISO). |
| phase | Phase: size 1 x 1 x k (SISO). |
| w | Frequencies: a vector: 1 x k. |
bodeplot(sys) generates a Bode plot of the SISO LTI system sys, like bode.
bodeplot(sys, opt) applies the plotting options described by opt (see bodeoptions).
When opt.PhaseUnits is 'rad', the phase is plotted in radians. When opt.Grid is 'on', a grid is displayed.
A lineSpec character vector and a frequency specification w can also be provided, as with bode.
G = tf([3], [1 1/2 4]);
opt = bodeoptions();
opt.PhaseUnits = 'rad';
opt.Grid = 'on';
f = figure();
bodeplot(G, opt, '--');| Version | Description |
|---|---|
| 1.0.0 | initial version |